Visualizing Simulink Signals
This tutorial is the third in a series of tutorials that discuss the essential features of Simulink as required to model, simulate and analyse dynamic systems.
Specifically this tutorial covers topics related to viewing signals in a Simulink model. Since there are several different ways to do this the tutorial is split into the following sections,
See the Simulink Essentials - Building and Simulating Models page for links to tutorials discussing how to construct a model in Simulink. Other tutorials discussing Simulink and its applications for model based design are available on the Software Tutorials page.
Scope and Display Blocks
Although there are a number of ways to visualize a signal in a Simulink model the most common are to use either a Scope block or a Display block. Both of these blocks are obtained from the Sinks library and connected to the signal to be viewed in the same manner as other blocks (see Connecting Blocks).
The Display block displays the numeric value of a signal at each time step throughout the simulation. The Scope block displays the time trace of the signal.
The Scope block is opened (so that the signal trace can be seen) by double-clicking on it with the left mouse button. This may be done at any time before the simulation is executed (see Starting a Simulation), during the simulation, or after it has finished.
Figure 1 shows the simulation results for the simpleModel developed in the Model Building with Simulink part of this tutorial series.
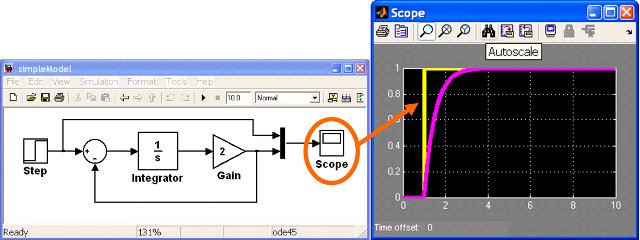
Not that as shown in Figure 1, to overlay multiple signals in the same axis on a scope the required signals should be connected to a Mux block and then the output of the mux fed into the scope.
Scope blocks have various tools available for zooming in and out to better view the signals being displayed. Figure 2 gives an overview of these tools.
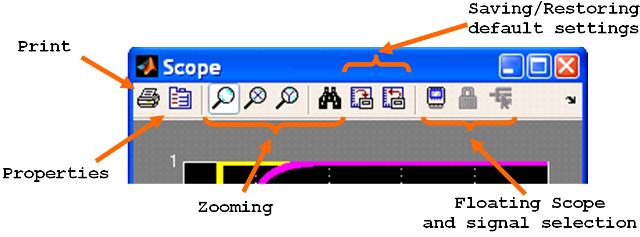
If the scope isn’t showing the expected values then there are a couple of initial actions to take. The first is to press the toolbar button that has a pair of binoculars on it (see Figure 2). This will do a fit to view, thus displaying all the available data.
The second thing to do is open the scope’s Properties dialog box (see Figure 2); go to the Data History tab; and de-select the Limit data points to: check-box. Then re-execute the model. This will ensure that the simulation stores all available data not just the last 5000 time steps.
If after performing both of the above operations the signal still isn’t as expected then there is most likely something more serious wrong with the model.
Signal Viewers
An alternative to physically placing a Scope or Display block in a model is to attach a Signal Viewer to a signal. This is a feature for viewing a signal without potentially cluttering the diagram with blocks that aren’t integral to the system dynamics being modeled.
When a Signal Viewer is attached to a signal a small icon -- a pair of glasses -- appears next to the signal in the model. This is shown in Figure 3. To open a signal viewer double-click the left mouse button on the pair of glasses icon.
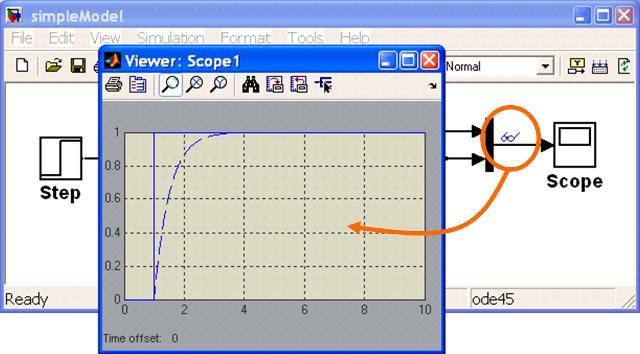
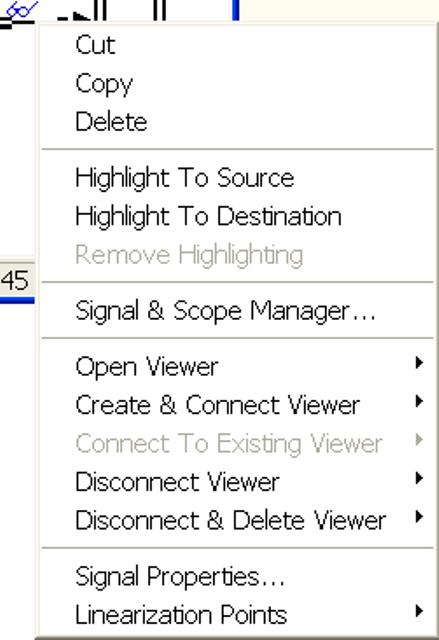
To attach a Signal Viewer right click on the signal of interest and select the Create & Connect Viewer option. This is shown in Figure 4.
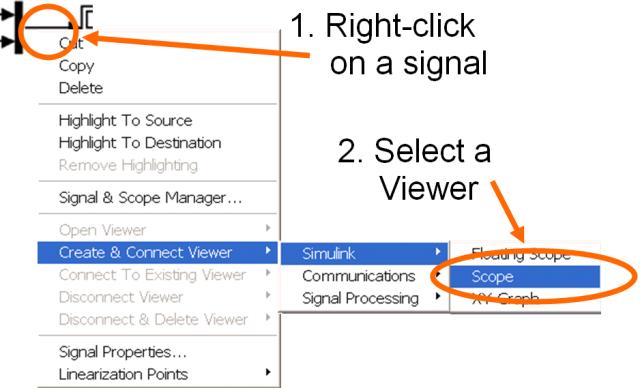
As with a normal scope a Signal Viewer scope may have multiple signals attached to it and have multiple axes on it. Altering a Signal Viewer’s properties, or deleting it, is achieved by right clicking on the required signal and selecting the appropriate option. This is shown in Figure 5.
This tutorial has discussed topics related to viewing signals in a Simulink model. It is the third and last tutorial in the series Simulink Essentials - Building and Simulating Models. Other Simulink tutorials are available on the Software Tutorials page.